Storyline: Charts that tell stories.

One of the most common problems we see in data storytelling is how and when to introduce an editorial layer onto a visualization. Mobile devices afford us very little real estate to work with, and interactivity must be limited. But without a “story” layer, users are left without the context to understand what events might impact or inform a trend. They see something going up or down but don’t see why. “Storyline” will be a tool for creating stories around line graphs.

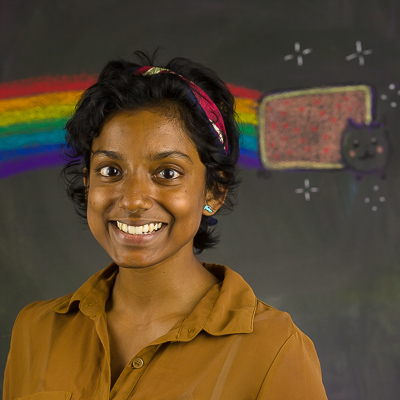
Faculty and Staff Leads

Emily Withrow

Assistant Professor

Story mechanic - maintaining the engines of great storytelling across platforms. Current research focus - voice user interfaces. Past life - @TheAVClub, @McKinsey.

Divya Sasidharan

Engineer, 2016-2017

Island/City girl living in small town O Hi O. Tea drinker in a coffee drinking world.

Zach Wise

Associate Professor

Emmy winning interactive producer & Associate Professor @NorthwesternU, @KnightLab. Formerly of The New York Times. Creator of TimelineJS & StoryMapJS

Project Details

2016 Fall

Presentation Slides